This is a collaborative space. In order to contribute, send an email to maximilien.chaumon@icm-institute.org
On any page, type the letter L on your keyboard to add a "Label" to the page, which will make search easier.
Eyelink basic preprocessing with dataHandler
Prerequisite
You need the Eyelink recording files in the original .edf format.
You also need access to the Eyelink software, Matlab, and dataHandler.
Goal of this tutorial
This tutorial teaches you how to read the Eyelink files and create markers corresponding to the different eye-related events (blinks, saccades) using dataHandler. These markers can be used as events for MEG data analysis.
Step-by-step guide
1. The Eyelink data files
a. During acquisition
The name you choose for this file has to be short, otherwise it can create problems when saving the data. When saving the data with your stimulation script, you need to leave some time for the system to save the file (with a command waitsecs after the command to save the Eyelink data, for example), otherwise the file will be corrupted or not saved.
b. Data conversion after acquisition
Eyelink data is saved in .edf format by the software. After your recordings, you have to convert the .edf file to .asc. You can use the Eyelink software installed in the stimulation computer at the MEG.
c. Inside the data file
The .asc data file can be viewed as a text file, using the command
gedit run1.asc
This file contains a header with information related to the acquisition (date, Eyelink version, format conversions performed…). You will also see information about the calibration(s) data were done, and then 4 columns of numeric values: the 1st column is the sample number, the 2nd column is the x coordinate of the eye position on the screen, the 3rd column is the y coordinate, and the 4th column is the pupil diameter.
Some eye-related events are automatically identified by Eyelink:
- Fixation: SFIX and EFIX for start and end fixation
- Saccades: SSACC and and ESACC for start and end fixation
Next to EFIX and ESACC, the numbers indicate the sample corresponding to the end of fixation/saccade, the sample corresponding to the start of the fixation/saccade, the duration of the fixation/saccade, the x, y coordinates and the pupil diameter.
2. Creating markers with Eyelink information
a. Insert markers
To insert Eyelink markers from a run1.asc file on a run1_trans_tsss.fif file, you can use the following dataHandler command on a terminal:
dataHandler -r -edf run1.asc run1_trans_tsss.fif
You can also run this command from matlab, by doing the following:
str_Eyelink = 'dataHandler -r -edf run1.asc run1_trans_tsss.fif';
command(str_Eyelink)
For help on this dataHandler function, type from a terminal:
dataHandler -help -edf
b. What are these Eyelink markers
Eyelink markers are saved in run1_trans_tsss.mrk. You will find different sorts of markers:
- EL_SBLINK_R, EL_EBLINK_R: these indicate the beginning (SBLINK) and the end (EBLINK) of blinks. '_R' indicates the eye chosen during the recording ('_R' for right or '_L' for left).
- EL_SSACC_R_0, EL_ESACC_R_0, EL_SSACC_R_1, EL_ESACC_R_1...: beginning (SSACC) and end (ESACC) of a saccade. 'R_' indicates the eye chosen during the recording ('_R' for right, '_L' for left). The number indicates the amplitude in degrees of visual angle: 0 for angles < 1 degree, 1 for angles < 2 degrees…, 5 for angles > 5 degrees.
No information about the pupil diameter is entered automatically. You will have to read it yourself, either by reading the .asc file, or by using the acquisition data channel where Eyelink pupil diameter data was sent to at recording.
c. How to read these markers with fieldtrip
You can read the .mrk file using the function my_ft_read_event. For more information, see 'Computing ERPs'.
3. Some adjustments and checks to make
a. Visualize the markers
To visualize the markers, you can open your .fif data file with Muse, it will automatically read the corresponding .mrk file containing the Eyelink markers.
You will be able to browse through the data, especially EOG if you had it recorded, to check that the markers are where they should be.
You can also visualize the 3 channels on your data file containing the Eyelink data (x coordinate, y coordinate and pupil diameter), usually set up at acquisition.
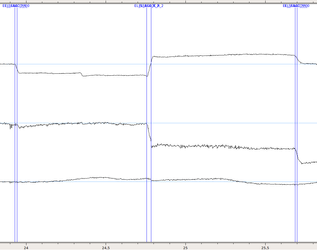
Example of saccades: The first two channels correspond to the position of the eye on the screen, the last channel corresponds to pupil diameter. The markers here indicate the beginning and end of saccades. You can see that the second saccade (EL_SSACC_R_2 / EL_ESACC_R_2) was larger than the others (EL_SSACC_R_0 / EL_ESACC_R_0). The first saccade was defined only along the x-axis (horizontal eye movement).
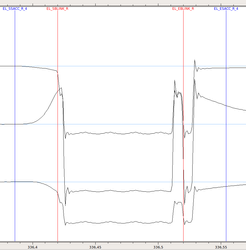
Example of blink: You can see here the occurrence of a blink, delimited by the red markers. Note how this blink was preceded and followed by a saccade, corresponding to the eye movement associated with the blink. Note also how blinks affect all measures (position on the screen and pupil diameter).
b. Incorrect pupil diameter data
It can happen that Eyelink is not able to measure the pupil diameter, so you will see saturated signal. This may not be detected by any automatic Eyelink marker, so you have to check for that.
c. Blink time window
If the precise time window defining a blink is of some importance for your analysis, you should check the Eyelink blink markers. The blink window defined is typically rather restricted, so you may want to add some extra timing before and after, to extend the blink time window. For example, in the figure above illustrating a blink, you can see how the red markers delimiting the blink could have been extended in order to catch all the blink event.
Related articles

