This is a collaborative space. In order to contribute, send an email to maximilien.chaumon@icm-institute.org
On any page, type the letter L on your keyboard to add a "Label" to the page, which will make search easier.
Computing ERPs
Prerequisite
Continuous MEG/EEG data has been acquired.
Before following this tutorial, you should have performed the following operations on your data:
- preprocessed the continuous data (Maxfilter, re-referencing, filtering)
- detected and marked artefacts
This tutorial uses the FieldTrip toolbox (see here for how to initialize FieldTrip)
Goal of this tutorial
This tutorial teaches you how to go from your continuous recording to the average evoked response (ERP/ERF).
This tutorial complements the FieldTrip tutorials on ERP computation ('Preprocessing - reading continuous EEG data' and 'Preprocessing of EEG data and computing ERPs'), and will give some additional information specific to the MEEG center.
Step-by-step guide
1. Dealing with events
events in FieldTrip
in FieldTrip, events are represented in a MATLAB structure:
For each trigger, you have the following fields:
type: either the channel where triggers were recorded (e.g.STI101), or the name of the eventsample: the sample numbervalue: the value of the triggeroffset: usually an empty fieldduration: the duration of the trigger (usually empty or a constant number)
a. Events in original .fif format
You can use the ft_read_event function.
This will give you a data structure, with all the triggers found in the data.
These are the triggers you sent during recording.
b. Events in .mrk file
If your events have been read, modified or added with dataHandler or Muse, you have a '.mrk' file with all the occurrences of the events. The advantage of having such a file is that Muse will automatically read the events and plot them together with your continuous data.
You can open this file using a terminal, with the following command:
gedit run01_trans_tsss.mrk
don't edit .mrk files by hand
Do not try to edit .mrk files by hand. These files are more intricate than they seem and other software will not be able to read it.
To read these events in MATLAB, you can use the in-house function my_ft_read_event.m
Events = my_ft_read_event('run01_trans_tsss.mrk');You will get a structure containing all the events found in the data, in the correct FieldTrip format (as shown above).
c. Editing events of interest
You can then rename the events (by writing a meaningful string in the field .type, for example 'StimPresentation'), create new events and add them to this structure or create new structures with subsets of events. For example, you can create new events corresponding to specific combinations of conditions or corresponding to clean data (ex: StimPresentation_noEOG, meaning that there are no EOG events in a time window of interest around the event StimPresentation). Creating specific events, corresponding to clean data, will make your life easier, because you can directly create your final epochs based on those events.
See here for tricks you can do to read and extract information from the events structure.
If you downsample your data, make sure the event sample numbers correspond to the new data sampling!
2. Epoching the data
Now that you have your events, you can epoch, i.e. extract the data around the event of interest.
Check out the FieldTrip tutorial, here.
Briefly, you epoch the data in two steps:
- Define epoch timings relative to the continuous data, using ft_definetrial. This function creates a Nx3 matrix where the first column is the first sample of each of the N epochs, the second column in the last sample of each epoch and the third sample is the offset. You can also create this matrix manually, if your epoch definition is more complex (ex: epochs with different lengths).
- Use ft_redefinetrial to cut the data according to the epoch definition. This will output a data structure with all your data epochs.
Beware that filtering epoched data may lead to edge effects! See this page.
3. Averaging over trials
Once your data is cut into epochs, you may want to average them. For this, you can use the function ft_timelockanalysis.
You can't average epochs with different lengths, in that case this function will throw an error.
4. Averaging over subjects
To average EPRs/ERFs over a group of subjects, use the function ft_timelockgrandaverage.
You can specify
cfg.keepindividual = 'yes';
if you want the final data structure to contain the ERPs/ERFs of each subject.
Alternatively, use
cfg.keepindividual = 'no';
to get only the grand average ERP/ERF over all subjects.
5. Plotting
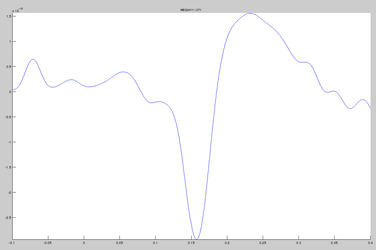
a. Timecourse of the ERP/ERF
You can use the function ft_singleplotER to plot the timecourse over a single channel or a group of channels (average across selected channels).
Example of a timecourse of a single channel:
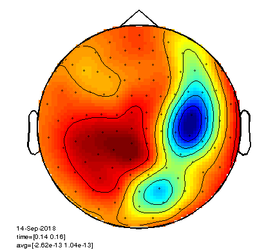
b. Topography of the ERP/ERF
You can use the function ft_topoplotER to plot the topography of the ERP over a specified time window (data is averaged over this time window).
Example of a topography:
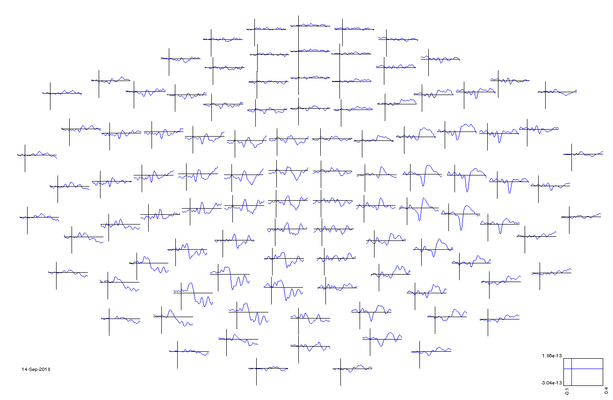
c. Multiplot
You can use the function ft_multiplotER to plot the timecourses of all channels, displayed according to their layout.
Example of a multiplot:
Related articles